Archive data
Wordle statistics
A plain-English guide to completed puzzles, solver difficulty, answer shapes and opt-in player reports. Data runs through 22 September 2026.
Start with the big picture: the archive contains 1,922 completed puzzle dates since 19 June 2021 and 1,898 distinct answer words. Those totals differ because answers can repeat.
A puzzle appearance means one answer on one completed date. A distinct answer means one spelling, counted once even if it later returns. Keeping those units separate helps you read the repeat totals correctly. It also prevents a growing calendar from being mistaken for a growing vocabulary.
What the solver numbers mean
One fixed solver averages 3.51 guesses across the recorded puzzles, with 94.1% of its routes ending on guess three or four. The solver follows the same repeatable policy for every answer. That makes it a useful ruler for comparing puzzles. It is not a target for players, a claim of perfect play or an estimate of the worldwide human average.
The average is only a summary. The distribution shows how often the solver finished in two, three, four, five or more turns. The ranked lists show the ends of that distribution. A high solver-pressure percentile means an answer took a harder route than most other completed answers under this one policy. It does not mean that every person found the puzzle equally difficult.
Some answers are difficult because several familiar candidates fit the same clues. Those groups are often called trap families. A repeated letter can also make feedback harder to read because one gray copy does not always mean that the letter is absent. The difficulty section links to individual puzzle records so you can inspect the route instead of relying on a score alone.
What kind of words become answers?
The page compares two word lists with different jobs. The accepted-guess list contains 14,855 words the game may allow you to play. The smaller working answer pool contains candidates this site's solver may keep as possible answers. The charts compare starting letters, final letters and the share of words containing each letter. Pool membership does not reveal or predict a future answer.
Percentages make the two lists easier to compare because their sizes differ. For example, a letter may appear in more accepted guesses as a raw count but still make up a larger share of the answer pool. The visible values and downloadable tables give the numbers behind every bar, so you do not need to estimate a result from color or length.
Repeats, near misses and changes over time
A repeat is the same answer on a later completed date. A near miss is a different recorded answer that changes in exactly one position. These measures answer different questions. Repeats describe reuse across dates. Near misses describe how tightly answer words cluster, which can help explain why an endgame felt crowded.
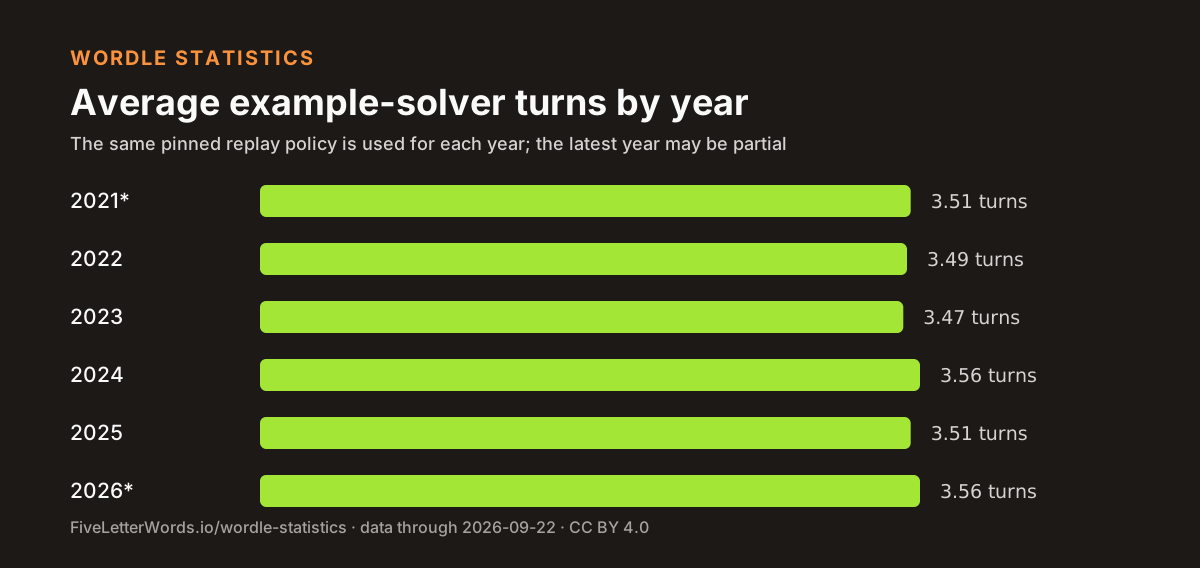
The yearly table applies the same solver benchmark to every period. That makes the averages comparable, but it does not prove that an editor changed the game's difficulty. A short run of hard puzzles can move a monthly impression while barely changing a full-year average. A year still in progress is marked as partial and should not be treated as a final result.
Solver data and player reports are separate
The solver figures come from the completed answer archive, fixed word lists and one reproducible replay policy. The player figures come from the Wordle Observatory. People choose whether to submit to the Observatory, so its results describe that participating sample rather than all Wordle players. Small groups remain hidden until they meet the stated publication threshold.
Figures include completed puzzles through 22 September 2026. The page recomputes automatically as the completed archive advances, while the editorial review date stays fixed until the explanation or method receives another material review. That distinction lets the values remain current without pretending the article was rewritten every day.
Choose the question you want to answer
- How difficult were past puzzles for one fixed solver? Read the full distribution, not just its average.
- How does the answer pool differ from the guess list? Compare starting letters, endings and letter presence.
- Do answers repeat, and what is a near miss? Separate reused words from one-letter-apart families.
- Is Wordle getting harder? Compare years under the same benchmark and keep partial years in view.
- What do players report? Read the opt-in Observatory sample separately from solver results.
Every section states its unit, source and limitation. Read those notes before comparing numbers from another site, especially when the date range, answer pool or definition may differ. The downloadable tables and methodology section are there for readers who want to reproduce a result or reuse a chart with its proper context.
How many turns did the fixed solver need?
The same procedure replays every completed puzzle. That gives us a fair comparison between answers, but it does not grade people.
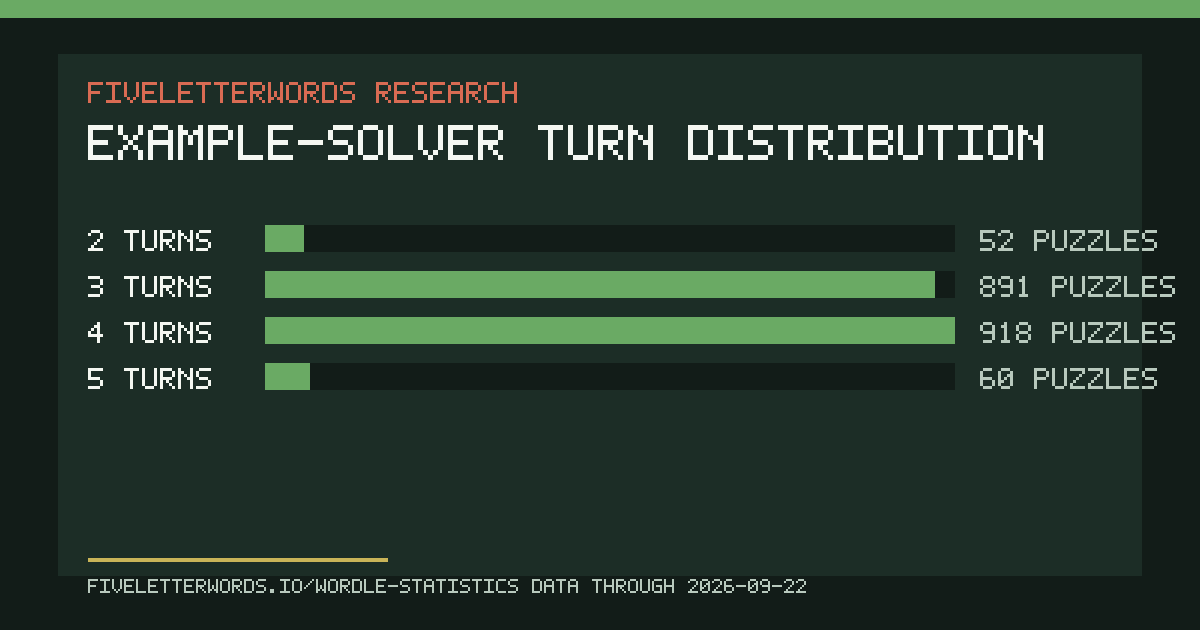
Reuse this figure: download the values as CSV, download the publication-ready SVG, or download the PNG.
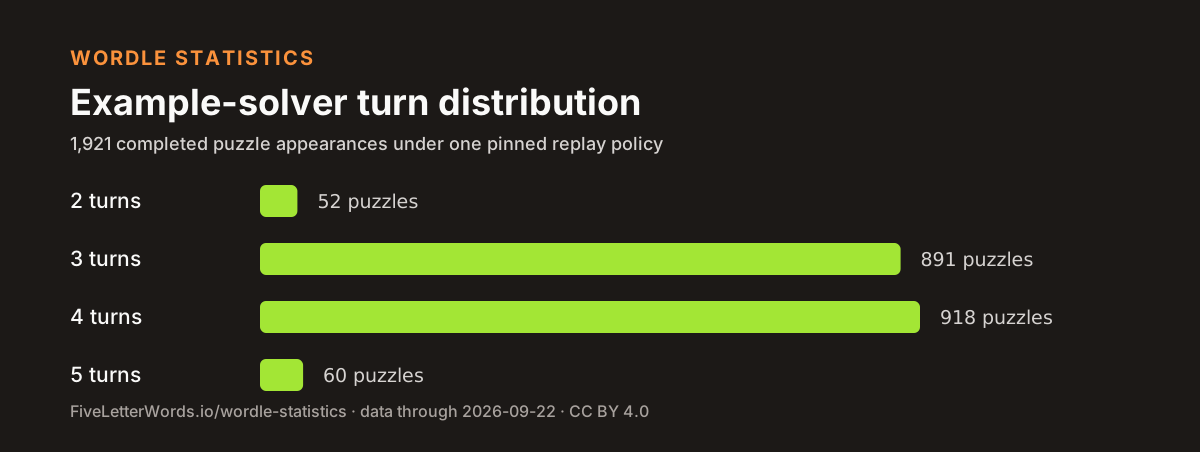
Mean of the solver-benchmark line lengths over all 1,921 benchmarked puzzles. Use it as the comparison ruler for the yearly figures below, not as a target for human play.
Share of recorded puzzles the benchmark solves on guess three or four. The narrow spread means single hard days move a weekly average more than any real trend does.
Puzzles where one reply to the fixed opener left a single leading candidate. These are uncommon and depend heavily on the opening feedback.
Puzzles that pushed the benchmark to five or more. Many belong to crowded one-letter-apart families.
Solver pressure is a percentile within recorded puzzles: 100 is hardest for this solver and 0 is easiest. It compares puzzles rather than grading players. The difficulty explorer contains the full ranking and the hardest Wordle words guide explains the common causes.
Answer pool versus accepted guesses
The accepted list answers “Can I play this word?” The working pool answers “Should the solver keep this word as a possible answer?” They are related lists with different jobs.
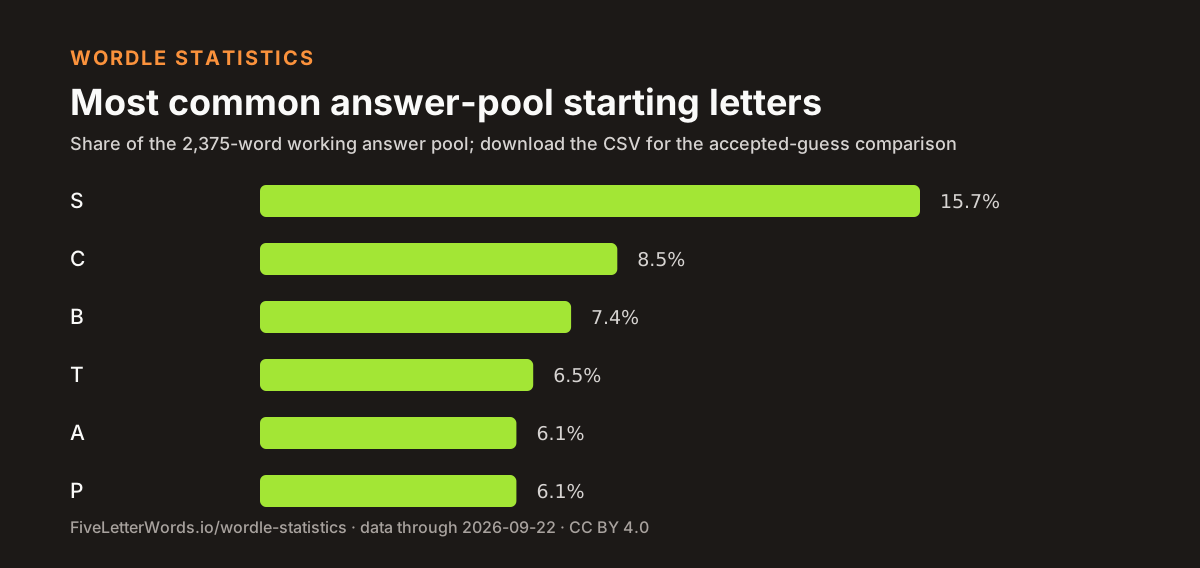
The chart below compares each leading starting letter in the answer pool with the accepted-guess list.
Skip to the interactive starting-letter comparison.
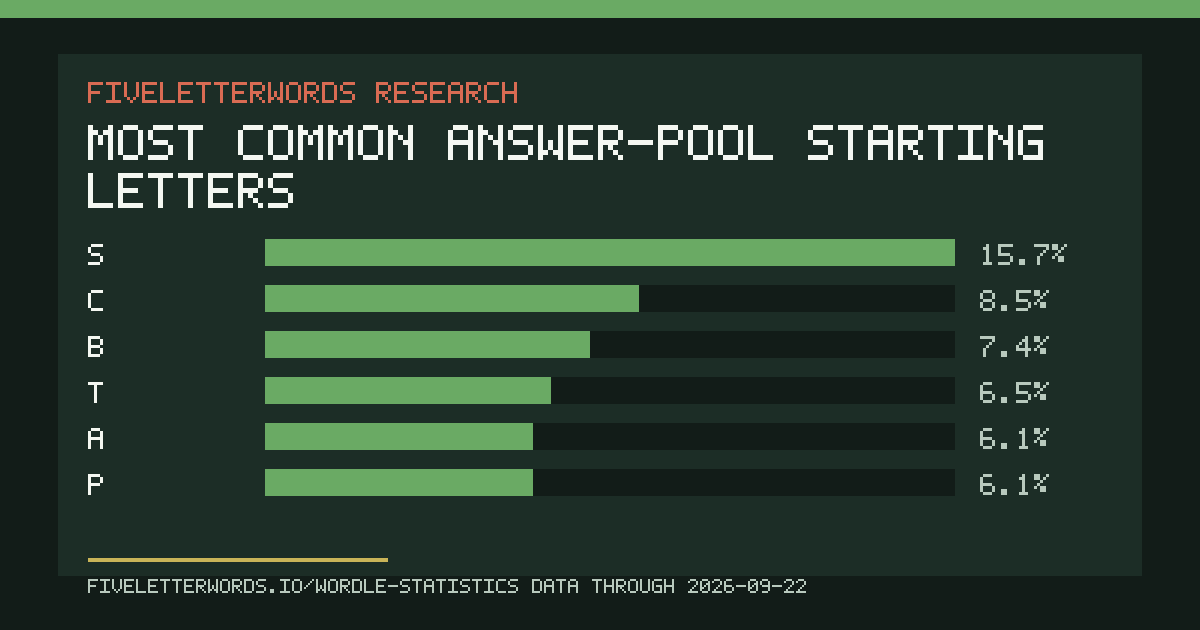
Reuse this comparison: download both series as CSV, download the answer-pool SVG, or download the PNG.
Mostly plurals. The guess dictionary is full of them, which makes final-S words feel like reasonable guesses.
The pool contains very few plural forms. In an endgame, this makes an otherwise equally plausible final-S candidate less likely within this pool.
| Final letter | Answer pool | Guess list | Gap |
|---|---|---|---|
| E | 18.2% | 11.7% | +6.5 |
| Y | 15.7% | 10.3% | +5.4 |
| T | 10.8% | 5.4% | +5.4 |
| R | 9.2% | 5.0% | +4.2 |
| L | 6.7% | 3.6% | +3.1 |
The answer pool concentrates its endings on fewer letters than the guess list, which also contains plurals and rare inflections. The S figures above show the largest difference. Download the final-letter table as CSV.
| Letter | Answer pool | Guess list | Gap |
|---|---|---|---|
| E | 45.5% | 42.8% | +2.7 |
| A | 39.3% | 42.1% | -2.8 |
| R | 35.9% | 29.9% | +6.0 |
| O | 29.1% | 30.7% | -1.6 |
| T | 28.8% | 22.9% | +5.9 |
| I | 28.3% | 28.0% | +0.3 |
| L | 27.8% | 23.4% | +4.4 |
| S | 26.7% | 44.0% | -17.3 |
A positive gap means that a letter appears in a larger share of the answer pool than of the guess list. Openers containing several such letters tend to rank well in the Opener Lab. Download the letter-presence table as CSV.
Repeats and near misses
A repeat is the same answer on another date. A near miss is a different recorded answer that changes in exactly one position. Keep those ideas separate.
Distinct words that have appeared as the answer on more than one date, out of 1,898 recorded answer words. The shortest recorded gap between appearances is about 1.4 years.
Pairs of recorded answers differing in exactly one position, such as SHADE and SHAKE. An answer attempt cannot test both missing letters at once.
Share of recorded answer words with at least one other recorded answer a single letter away.
| Word | First used | Used again | Gap |
|---|---|---|---|
| FOCUS | 13 March 2022 | 13 September 2026 | 4.5 yrs |
| CLICK | 31 October 2021 | 25 August 2026 | 4.8 yrs |
| TRACE | 15 December 2021 | 21 August 2026 | 4.7 yrs |
The largest one-letter-apart families
- _ATCH BATCHCATCHHATCHLATCHMATCHPATCHWATCH 7 answers
- _OUND FOUNDHOUNDMOUNDPOUNDROUNDSOUNDWOUND 7 answers
- SHA_E SHADESHAKESHAMESHAPESHARESHAVE 6 answers
- _IGHT EIGHTLIGHTMIGHTNIGHTRIGHTSIGHT 6 answers
Every word above has already been an answer, but unused words in the same families may remain in the pool. When several candidates share a pattern, use a probe that covers several differing letters instead of testing the candidates one by one. The living repeat tracker owns the complete dated repeat evidence, while the second-guess tool compares probes for crowded families. Download the answer-word-free summary as CSV.
Is Wordle getting harder?
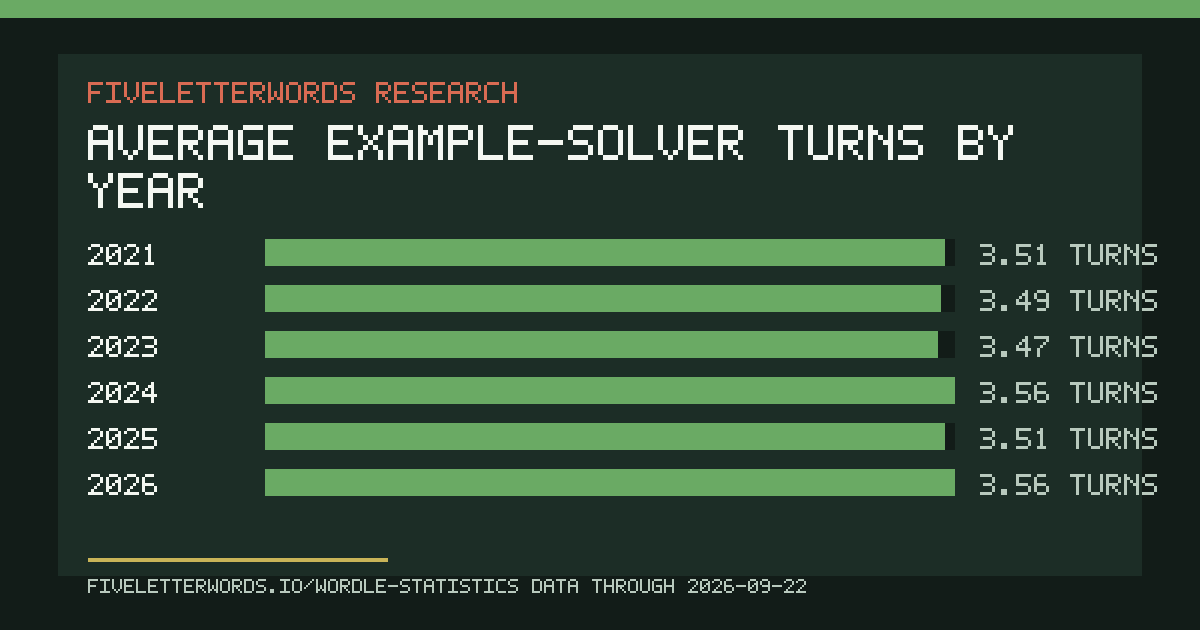
Every year uses the same solver and word lists. “Hard days” means puzzles in the top tenth of solver pressure across the whole archive. A partial year has an asterisk.
| Year | Puzzles | Avg guesses | Hard days | |
|---|---|---|---|---|
| 2021* | 196 | 3.51 | 10.2% | |
| 2022 | 365 | 3.49 | 9.3% | |
| 2023 | 365 | 3.47 | 9.9% | |
| 2024 | 366 | 3.56 | 9.6% | |
| 2025 | 365 | 3.51 | 12.1% | |
| 2026* | 265 | 3.56 | 12.5% |
The gap between the easiest and hardest year averages is 0.09 guesses, within the roughly 0.13-guess range that chance alone produces for year-sized samples of this benchmark. Treat year-to-year movement as noise, not a trend. All bars use the same scale. The "hard days" share varies more than the yearly average. The answer list is curated rather than randomly sampled, so a change here may reflect answer selection and may reverse later.
Reuse the yearly series: download the values as CSV, download the chart as SVG, or download the PNG.
What players report
These figures come from voluntary submissions. They describe contributors to the Observatory, not all Wordle players.
Games players explicitly chose to share with the Observatory. A self-selected sample: contributors skew toward engaged players, so read every figure below as describing them, not all players.
Distinct puzzles with at least one contributed game. Per-puzzle rows publish only at 10+ games; smaller samples are held back rather than shown.
The solve rate publishes once every outcome cell clears the 10-game minimum.
This publishes after the sample reaches the minimum size.
Contribute a game or read the full method on the Observatory page; the per-puzzle aggregates are downloadable as CC-BY CSV.
Where the numbers come from
The article updates when the completed archive advances. The date at the top is the newest puzzle included. This render belongs to snapshot current-2026-09-22-dd22a2c5d10b681d. If even one required history or difficulty row is missing, the page becomes unavailable instead of quietly publishing a smaller total.
“Recorded puzzles” means dated, worldwide-completed entries. The working answer pool and accepted-guess list are maintained solver inputs, not predictions. Benchmark results use one fixed policy and do not claim optimal play.
- The site's opener scoring, benchmark replay policy and data provenance are documented on How the solver works. Downloadable datasets are on the data page.
- The open What makes a Wordle hard? study tests branch size, trap families, repeated letters, letter-position rarity and familiarity against pinned example-solver turns, with a frozen model, uncertainty intervals and answer-word-free analysis table.
- Greenberg, Ronald I. Effective Wordle Heuristics (2024). arXiv:2408.11730. arxiv.org/abs/2408.11730. Partition heuristics come within a few hundredths of a guess of exhaustive search, supporting the use of fast heuristic scoring here.
- Lokshtanov, Daniel and Subercaseaux, Bernardo. Wordle is NP-hard (2022). arXiv:2203.16713. arxiv.org/abs/2203.16713. The paper proves that guaranteeing a solve within a set number of guesses is NP-hard in general.
- Selby, Alex. The best strategies for Wordle. sonorouschocolate.com. Exact search gives SALET a 3.4212-guess average on the original lists and TARSE a 3.5526 average on the current expanded lists. Bertsimas and Paskov independently confirmed the SALET figure in An Exact and Interpretable Solution to Wordle (2022). This page's 3.51-guess figure comes from a fixed replay policy, not an optimal-play claim.
Questions, source requests and corrections are handled through the press and research correction route. Material corrections are dated rather than silently rewriting a cited conclusion.
Common questions
- What is the average Wordle score, according to the statistics?
- A fixed solver benchmark replayed over all 1,922 recorded puzzles averages 3.51 guesses. The site's opt-in crowd average is published only once at least 10 contributed games back it; below that floor the figure is held back rather than shown on a thin sample.
- How many Wordle answers have there been?
- This site has recorded 1,922 dated puzzles from 19 June 2021 through 22 September 2026, using 1,898 distinct words; 24 words have appeared more than once.
- What is the statistically hardest Wordle word so far?
- By the site's solver-pressure measure, PUPPY (Jun 30, 2026) ranks hardest among recorded puzzles. That measure scores how much a consistent solver replay struggled, not how players felt on the day.
- Is Wordle getting harder over time?
- The gap between the easiest and hardest year averages is 0.09 guesses, within the roughly 0.13-guess range that chance alone produces for year-sized samples of this benchmark. Treat year-to-year movement as noise, not a trend.
- Where do these Wordle statistics come from?
- The figures use the site's recorded past-answer archive, a reproducible solver benchmark documented on the how-the-solver-works page, and opt-in player reports. External context comes from published research: Greenberg's 2024 heuristics study, the Lokshtanov-Subercaseaux NP-hardness proof, and Alex Selby's exhaustive-search results. Figures recompute automatically as the archive grows.
Read the starting-letter chart
Choose a starting letter
The result compares percentages, not raw counts, because the two lists have different sizes.